


Carbon footprint

A carbon footprint is like a medical check-up: everyone wants to see the results, nobody wants to do the tests.

Free 15‑minute call

Industrial area seen from above, with white smoke rising from chimneys

A map to efficiency and profit

Calculating your carbon footprint is not just an obligation. It is the best diagnosis you can run on your business to find out where you lose money and how to build a lasting competitive advantage.

Mountain road winding through forest, seen from above

What is a carbon footprint, exactly?

In short, it is the total greenhouse gas emissions generated by your company’s activity. For a complete picture we look at three levels:

Trees in a forest marked with question marks

Scope 1

Direct emissions from sources you control (e.g. your vehicle fleet, on-site combustion, internal processes).

Scope 2

Indirect emissions from the energy you buy (e.g. electricity, heating).

Scope 3

Emissions across your whole value chain (e.g. suppliers, transport, business travel). Essential for a complete picture, and what your customers count in their own Scope 3.

Why it matters now

Your emissions data is no longer only your business. It feeds other people’s decisions:

  • Group reporting: parent companies reporting under the CSRD need complete, consistent Scope 1, 2 and 3 data from every subsidiary, documented well enough for their assurance provider.
  • Finance: banks assess ESG risk and increasingly ask borrowers for emissions data. EU funding programmes ask for sustainability documentation.
  • Customers: multinationals collect emissions data from their suppliers for their own Scope 3. Calculate once, use everywhere.
  • Efficiency: you see exactly where energy and fuel are wasted, and turn those losses into savings.
Footprint of a shoe sole in the soil
Quick check

How big is your footprint, and what does it cost you?

Enter your annual consumption from your bills. We instantly estimate your Scope 1 and 2 emissions: where they come from and where you can reduce them. Everything is calculated in your browser; nothing is stored.

Annual consumption

The starting values are an example. Replace them with yours.

Enter the volume in m³ read at the meter, from your bill. The kWh figure depends on the gas’s calorific value, which varies from month to month, typically between 10.5 and 10.8 kWh per m³.

Calculation assumptions (you can change them)

The default, 0.20, approximates the average EU electricity grid; in your country it can be much lower or higher. Your electricity bill shows your supplier’s emissions in g CO₂/kWh: divide by 1,000 and enter the value here.

Average prices, excluding VAT

Emission factors: IPCC 2006 default values, also used in GHG Protocol tools and the EU ETS: diesel 2.68 kg CO₂ per litre, petrol 2.31 kg CO₂ per litre, natural gas 2.05 kg CO₂ per m³ or 0.182 kg CO₂ per kWh (56.1 t CO₂/TJ, on the gross calorific value shown on bills). To price gas entered in m³ we use 10.5 kWh per m³. Reduction percentages come from our projects.

Estimated footprint, Scope 1 + 2

– tCO₂e per year

– tCO₂e per employee

  • Fleet –
  • Heating –
  • Electricity –

Energy cost: – per year

Where you can reduce

  • Route optimisation and eco-driving8–15% of fleet emissions, based on our projects−– tCO₂e and – less on fuel, per year
  • Renewable electricitya contract with guarantees of origin−– tCO₂e per year (Scope 2, market-based method)
  • Fleet electrification −– tCO₂e per year, or – of the estimated footprint Fleet energy cost: – per year Simplified calculation: it does not include the cost of vehicles or charging points.

The calculation is indicative only and does not replace a full carbon footprint assessment. This is only part of your footprint. In our projects, the value chain (Scope 3) made up between 19% and 94% of the total.

Get your real footprint: free 15‑minute call

From raw data to final report.

Three steps, no headaches.

You don’t need to be an emissions expert. Give us access to your operational data and we do the rest.

  1. Industrial buildings with white smoke, seen from above

    Step 1

    Data collection

    We start with a detailed review of your company’s activities, from energy use to transport and waste.

    Data collection covers every emission source, direct (such as vehicle fuel) and indirect (such as purchased electricity).

  2. Hands placed one on top of another on a tree trunk

    Step 2

    Calculating emissions

    We use internationally recognised methodologies, such as the GHG Protocol, IPCC, EEA and Eurostat, to calculate emissions for each level: Scope 1, Scope 2 and Scope 3.

    The result is a clear, detailed picture of your company’s carbon footprint.

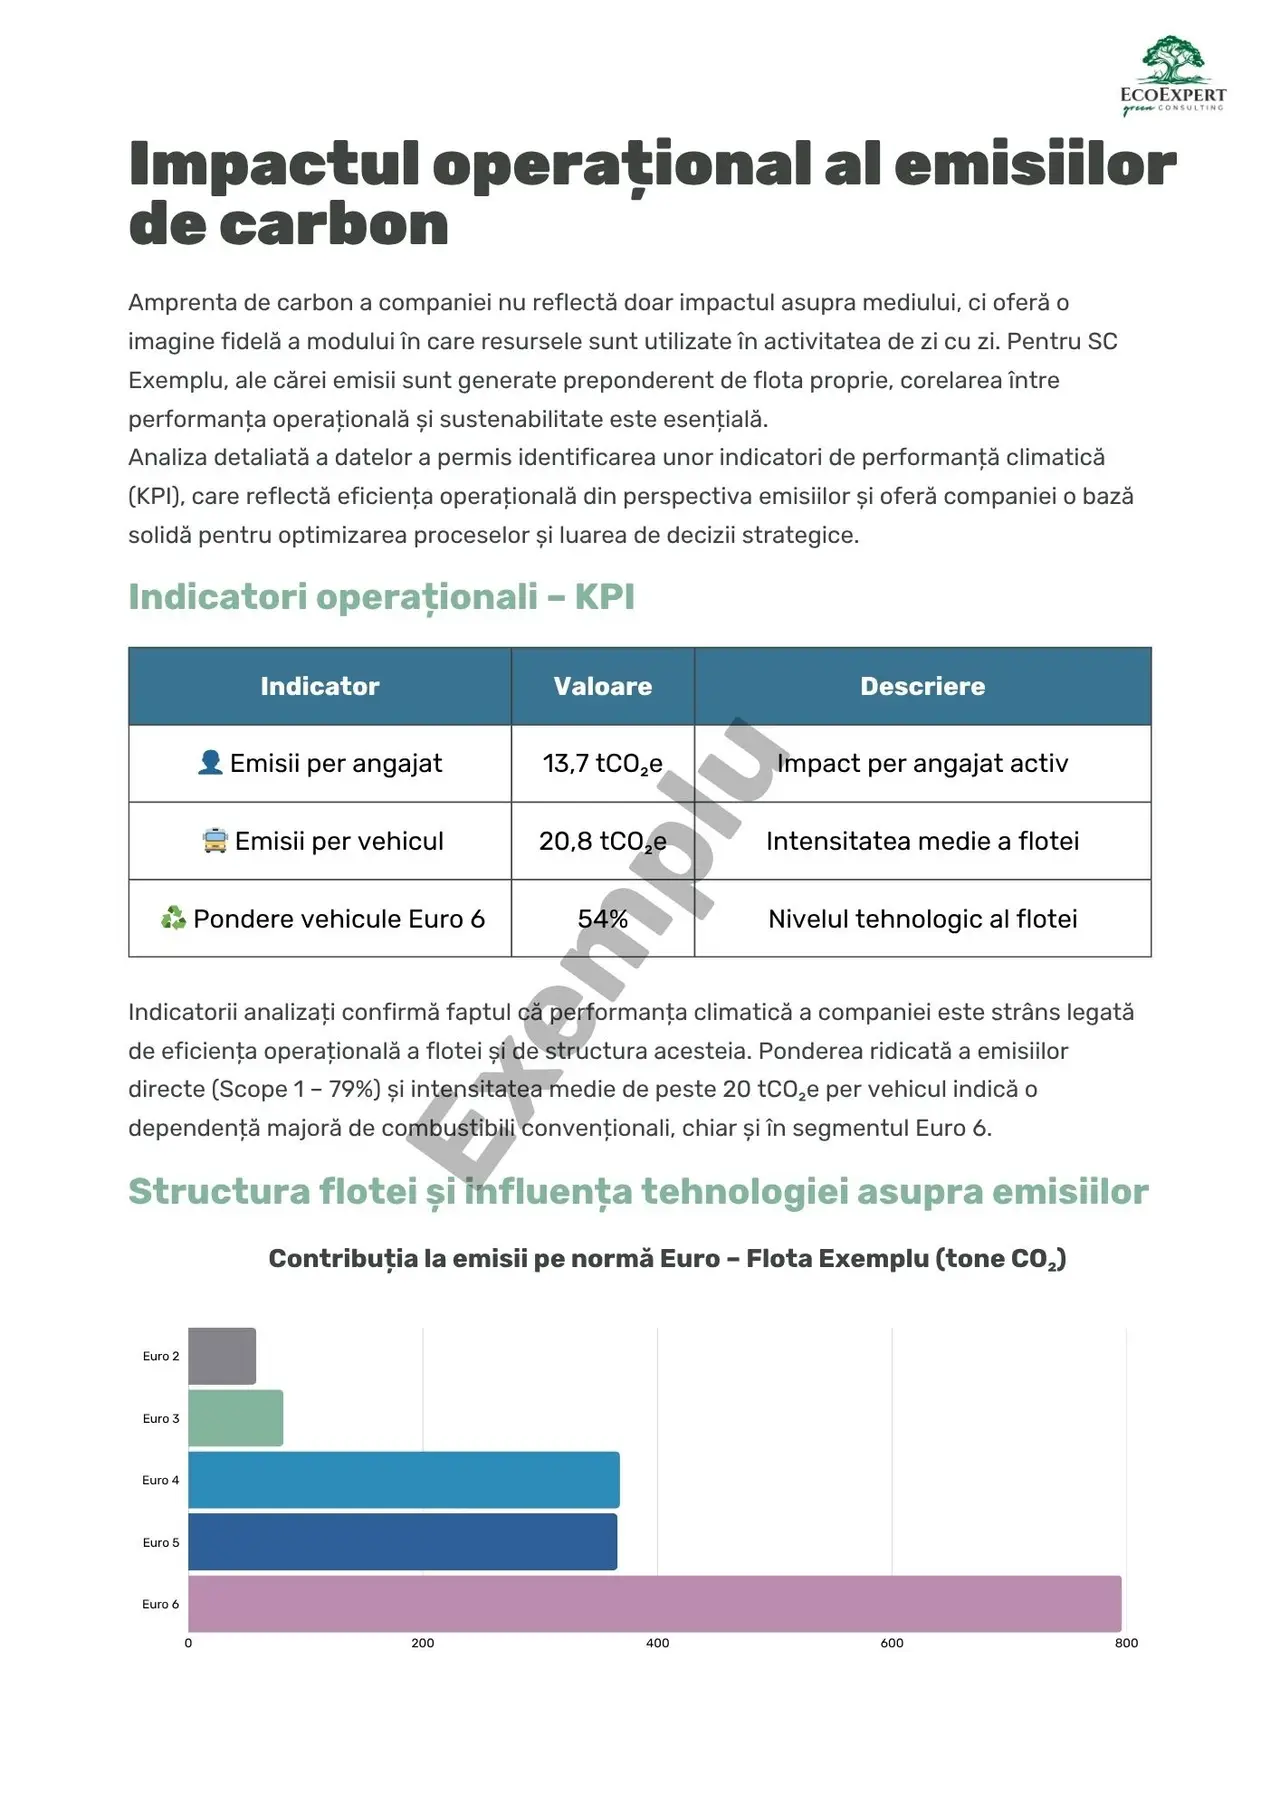
  3. KPI page from an EcoExpert report, sample

    Step 3

    Reporting the results

    You receive a detailed, structured report that is easy to read, showing the main emission sources and the exact quantities behind each one.

    It shows where emissions can be reduced, so you can plan your next steps with confidence.

A carbon footprint gives you a detailed picture of your emissions, from energy to operations and the supply chain. It is not just a data set but a strategic basis for the future of your business.

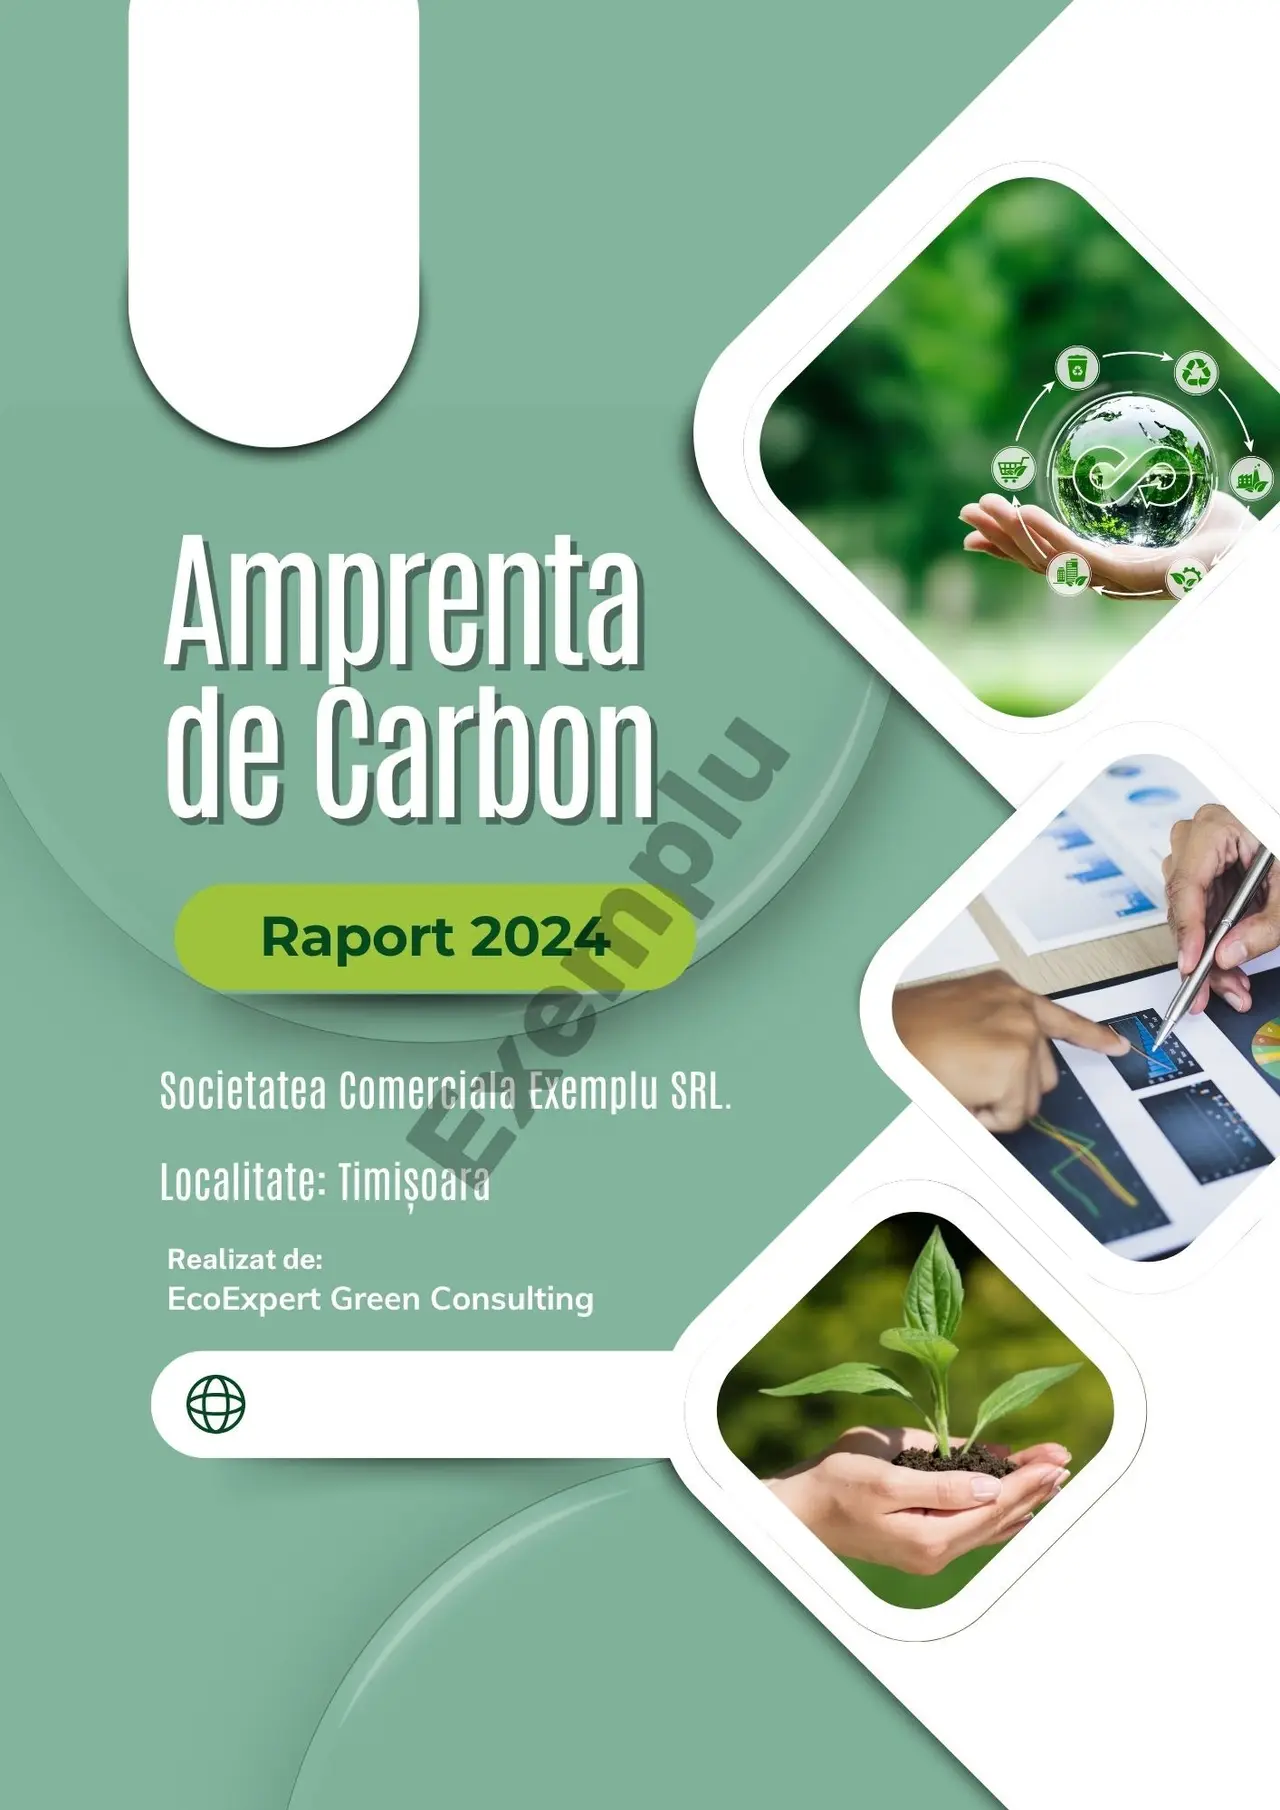
Cover of an EcoExpert carbon footprint report, sample
Sample deliverable

What the report looks like

You receive a detailed, structured report that is easy to read, showing the main emission sources and the exact quantities behind each one.

Pages from a real report (in Romanian), marked “Exemplu” (sample).

Case studies

Real projects, step by step

Road winding through a mountain valley
Case study · Carbon footprint

Carbon footprint for a passenger transport operator: from emissions to quantified measures

The fleet produces almost four-fifths of emissions. We showed where they come from, how the company compares with the market and which reductions are realistic, including electrification scenarios.

  • ~2,700tCO₂e, 2024 footprint
  • 79%of emissions come from the fleet
  • ~490tCO₂e/year less with a 20% electric fleet
  • GHG Protocol, Scope 1–3
  • Benchmark against Romanian and EU averages
  • Electrification scenarios
Read the case study

All case studies

What our clients say

Quality shows in the audit, not in the presentation.

Working with EcoExpert on our carbon footprint report was a valuable experience with solid results. The process was managed professionally from start to finish, and the team’s involvement made the difference.
Novaintermed SRLBucharest · translated from Romanian
We were impressed by the professionalism and clarity of the deliverables. The GHG analysis by EcoExpert Green gave us not just numbers, but real directions for improvement and opportunities for sustainable growth.
Ecovest Construct SRLOradea · translated from Romanian

Contact us

Tell us about your sustainability goals, and we will show you how to meet your net-zero commitments efficiently.